You are here
2015 Sees Sharp Rise in Post-Christian Population
The Barna Group
http://cities.barna.org/america-more-post-christian-than-two-years-ago/
August 16, 2015
While the United States remains shaped by Christianity, the faith's influence--particularly as a force in American politics and culture--is slowly waning. An increasing number of religiously unaffiliated, a steady drop in church attendance, the recent Supreme Court decision on same-sex marriage, and the growing tension over religious freedoms all point to a larger secularizing trend sweeping across the nation.
But how do the numbers stack up? Is America, home to the largest Christian population in the world, actually becoming a "post-Christian" nation? In a recent study, Barna Group analyzed 60,808 interviews conducted over a seven-year period to measure irreligion in American cities. Currently, 78% of Americans describe themselves as "Christian," but in order to dig deeper than just self-affiliation, Barna Group looked at a variety of key faith indicators for both belief and practice.
To measure a person's level of irreligion, Barna Group tracks 15 metrics related to faith (you can find the full list of 15 at the end of the article). These factors speak to the lack of Christian identity, belief and practice. These factors include whether individuals identify as atheist, have never made a commitment to Jesus, have not attended church in the last year, or have not read the Bible in the last week.
These kinds of questions--compared to ticking the "Christian" box in a census--get beyond how people loosely identify themselves (affiliation), and get to the core of what people actually believe and how they behave as a result of their belief (practice). These indicators give a much more accurate picture of belief in America.
To qualify as "post-Christian," individuals had to meet 60% or more of the factors (nine or more out of 15 criteria). "Highly post-Christian" individuals meet 80% or more of the factors (12 or more of these 15 criteria).
Where Are We as a Nation?
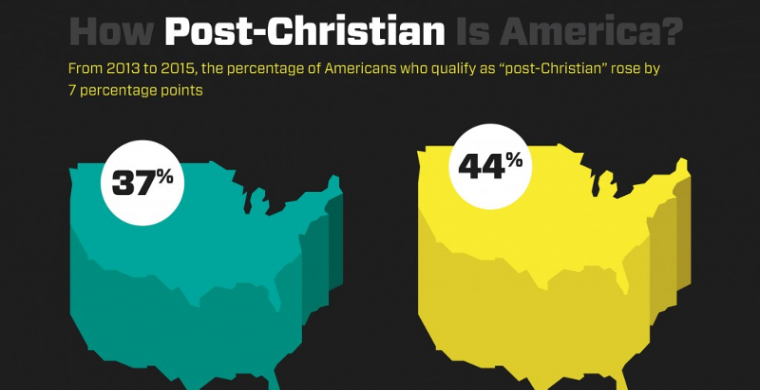
Whether one believes this decline of "Christian America" calls for a time of lament, or presents great opportunity (or both) for the church, one cannot help but accept the changing landscape. In just two years, the percentage of Americans who qualify as "post-Christian" rose by 7 percentage points, from 37% in 2013 to 44% in 2015. Across the United States, cities in every state are becoming more post-Christian--some at a faster rate than others
As was the case in 2013, the religiously unaffiliated and unchurched are concentrated in New England and the Northeast. Touted as the foundation and home-base of religion in America, and a region that often sets the political tone of the nation, New England dominates the post-Christian metrics, claiming five of the top 10 most post-Christian cities, including Boston, MA (65%), Providence, RI (60%), and Portland, ME (60%), with eight of the top 10 in the greater Northeast region.
The West coast is also fairly well represented among the top 15 cities, with San Francisco, CA (66%) climbing up the rankings from 6th place in 2013 to top the list as the most post-Christian city in America, and Los Angeles, CA (54%) coming in at 15th place. But other West coast cities like San Diego, CA (50%), and Portland, OR (51%) actually dropped out of the top 15 from 2013, either because of a decrease or minimal increase in post-Christian metrics compared to 2013. Other outgoing cities include Denver, CO (52%), and Cedar Rapids, IA (51%).
Newcomers to the top 15 cities include Las Vegas, NV (59%), Fort Myers-Naples, FL (56%), Chicago, IL (54%), and Los Angeles, CA (54%). These markets, and many others saw a higher than average increase, Las Vegas being a striking example, with an increase of 16 points over 2013. Boston, San Francisco, and Chicago all have similarly strong growth in their post-Christian populations, with increases of 12 to 13 percentage points in each city.
Post-Christianity by Region
The county's largest cities are a mixed bag with northern cities like New York (59%), Chicago (54%) and Philadelphia (54%), all shooting up the rankings compared to their 2013 spots. But southern cities like Houston (40%), Phoenix (51%), San Antonio (35%), and Dallas (32%) all dropped an average of 10 spots in the post-Christian rankings compared to their 2013 position. In most cases, the percentage of post-Christian residents did not change much in those cities.
The South and Midwest have both lower comparative, and slower rates of post-Christian growth. This is inline with these regions' typically higher rates of church attendance and self-identified Christians.
Cities like Birmingham, AL grew only slightly from a post-Christian population of 16% in 2013 to 18% in 2015. This is a similar story with cities across the South and Midwest like Nashville, TN (23%), Charlotte, NC (25%), Dallas/Ft Worth, TX (32%) and Columbus, OH (46%). These are all cities that have--and maintain--a much lower percentage of post-Christian individuals.
Post-Christian Metrics
To qualify as "post-Christian," individuals had to meet 60% or more of the following factors (nine or more). "Highly post-Christian" individuals meet 80% or more of the factors (12 or more of these 15 criteria).
Do not believe in God
Identify as atheist or agnostic
Disagree that faith is important in their lives
Have not prayed to God (in the last year)
Have never made a commitment to Jesus
Disagree the Bible is accurate
Have not donated money to a church (in the last year)
Have not attended a Christian church (in the last year)
Agree that Jesus committed sins
Do not feel a responsibility to "share their faith"
Have not read the Bible (in the last week)
Have not volunteered at church (in the last week)
Have not attended Sunday school (in the last week)
Have not attended religious small group (in the last week)
Do not participate in a house church (in the last year)
Comment on this research and follow our work:
Twitter: @davidkinnaman | @roxyleestone | @barnagroup
Facebook: Barna Group
About the Research
The data reported in this article are based on telephone and online interviews with nationwide random samples of 60,808 adults conducted over a seven-year period, through 2015.
The maximum margin of sampling error associated with the aggregate sample is plus or minus 0.4 percentage points at the 95% confidence level. All non-institutionalized adults in the 48 contiguous states were eligible to be interviewed and the distribution of respondents in the survey sample corresponds to the geographic dispersion of the U.S. adult population. Some interviews were conducted in Spanish, but the vast majority of the interviews were completed in English.
All telephone interviews were conducted by Barna Group. All households were selected for inclusion in the sample using a random-digit dial technique, which allows every telephone household in the nation to have an equal and known probability of selection. Households selected for inclusion in the survey sample received multiple callbacks to increase the probability of obtaining a representative distribution of adults. Regional quotas were used to ensure that sufficient population dispersion was achieved. There were also minimum and maximum ranges placed on the distribution of respondents within several demographic variables that were tracked during the field process to ensure that statistical weighting would not be excessive. When a particular attribute reached one of the parameters, the sampling selection process was varied to preclude individuals who did not meet the necessary demographic criterion, with the interviewer seeking a person from the same household who fit the desired criterion. Up to 30% of telephone interviewing was conducted on cell phones in the data represented in States.
Online interviews were conducted using an online research panel called KnowledgePanel® based on probability sampling that covers both the online and offline populations in the U.S. The panel members are randomly recruited by telephone and by self-administered mail and web surveys. Households are provided with access to the Internet and hardware if needed. Unlike other Internet research that covers only individuals with Internet access who volunteer for research, this process uses a dual sampling frame that includes both listed and unlisted phone numbers, telephone and non-telephone households, and cell-phone-only households. The panel is not limited to current Web users or computer owners. All potential panelists are randomly selected to join the KnowledgePanel; unselected volunteers are not able to join.
The survey questions pertaining to faith and demographics were analyzed in reference to two different geographic perspectives: by DMA and by state. The label "DMA" stands for Designated Market Area and represents a unique geographic area that also serves as a commonly accepted media market as defined by The Neilsen Company. DMAs have been configured so that the entire U.S. is assigned to one, and only one, of 210 DMAs. These are based on the television viewing habits of the residents in each county.
While there are 210 DMAs, this report contains data for 117. These are the areas in which Barna had a sufficient number of completed surveys with people from a given market. In most markets, we had a sample of 150 or more; a few smaller markets had a minimum of 100. We used the same minimum-level criteria for the states analyzed in this report.
Some calculations include data from The Nielsen Company/Local Television Market Universe Estimates and the U.S. Census Bureau.
© 2015, Barna Group